Nutrient Analysis
First Flush
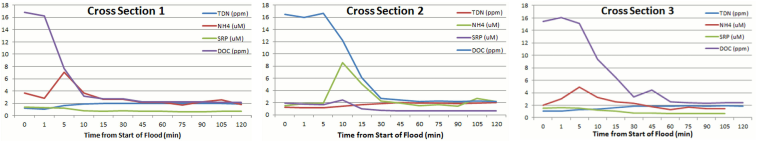
These graphs show the "first flush" of nutrients seen at each cross section when the first pump water is turned on.
Background Levels
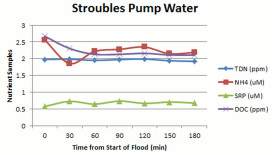
Background nutrient levels of the stream water pumped onto the floodplain.
TASCC Injection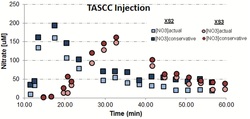
The longer breakthrough curve of cross section three is explained by the flow being separated into quick flow (beginning shoulder of curve) and leak from storage flow (long tail of curve)
|
Nutrient Uptake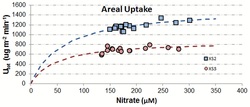
A higher uptake per area was seen in cross section two (storage zone) than in cross section three (mix of storage and quick flow).
|
